
Public debts are ballooning all around the world. And, after the coronavirus pandemic, the question will be how to handle them. One way to try to reduce the debt is through tax increases. The Laffer curve tries to model how tax rates influence the government’s revenue and the economic activity. What is the Laffer curve, and is it an accurate model of government earnings? Let’s see together how it works and debunk its unrealistic assumptions.
You can also watch my video “Laffer Curve Explained and Debunked!” on my YouTube’s channel. Check it out!
One quick word, even if the Laffer curve is used for political arguments, my goal here is to stay neutral and discuss it from an economic standpoint.
What is the Laffer curve?
First of all, what is the Laffer curve? The idea is to try to graph how government’s revenues evolve with changing tax rates. It is one of the main arguments of supply-side economics, which is a school of macroeconomic thought that argues that to maximize the economic output, you have to lower the barriers to production. And taxes are one of the obstacles. Both the Laffer curve and the supply-side economics lead the U.S. to the Reaganomics, the economic policies of President Ronald Reagan in the 1980s, and the Bush tax cuts, during the presidency of George W. Bush. They both argued that lowering the tax rate will increase government revenues.
Before diving into the Laffer curve, I wish to highlight the fact that the main ideas are old. Arthur Laffer himself does not claim to have invented it; on the contrary, he refers to Ibn Khaldun, the 14th-century Islamic scholar. And many more economists in the past have talked about the core ideas of the Laffer curve, from Adam Smith to John Maynard Keynes.
The Laffer curve’s core assumptions
The main assumptions of the Laffer curve are that the government’s revenue is known for two tax rates, 0 and 100%, and that the government’s revenue is continuous for all tax rates between.
The first assumption, which is a very sensible one, is that the government revenue is $0 when the tax rate is 0%. There is nothing to argue here.

The second assumption, which is on more shaky grounds than it looks, more on that latter, is that the tax revenue is also equal to $0 when the tax rate is 100%. Effectively, when all the money you earn is taxed away, why even bother to work? Let’s assume it to be true for now.
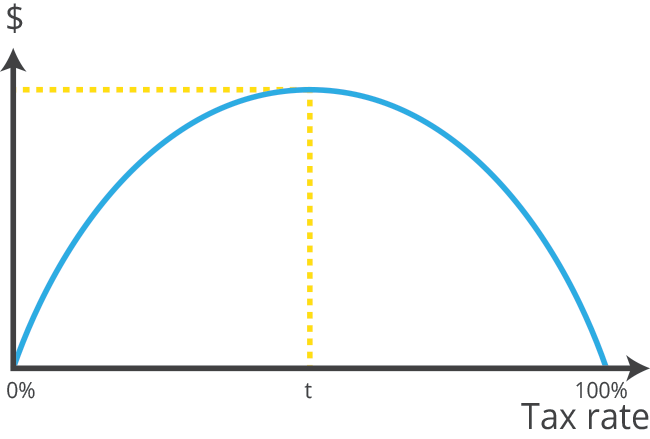
And for all tax rates between those two extreme points, the government gets a positive tax revenue, and this tax revenue is continuous. For any small change in tax rates, the tax income will change smoothly. This is the last assumption of the Laffer curve. This assumption is essential since it allows us to use the Rolle’s theorem, a simple calculus theorem, which implies that there must be, in our case, at least one maximum value for the government’s income.
And voilà, you get a nice bell curve. And you can see that there is an efficient tax rate, “t”, that provides the maximum tax revenue.
Sometimes you can see the Laffer curve with its axis flipped, the tax rate on the Y-axis, and the tax revenue on the X-axis. Don’t be confused by that; it is the same curve. I prefer to have it with the tax rate on the X-axis.
Two tax rates for the same tax revenue
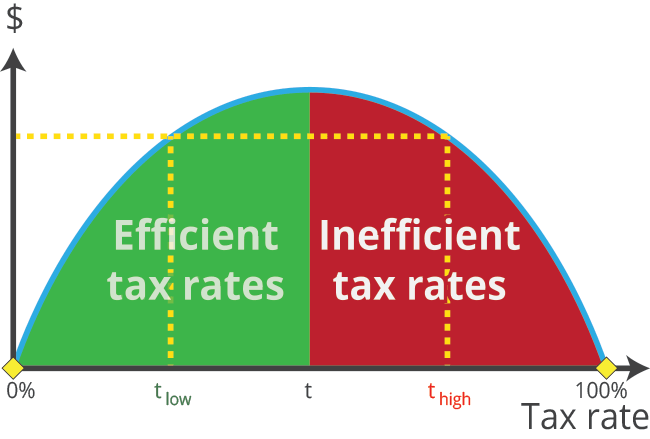
Should governments set their tax rates to match this most efficient tax rate? Not necessarily! Only if governments want to maximize their revenue, they should use it. However, it does not mean that it is a situation desired by the population. The most important lesson of the Laffer curve is that for a target tax revenue, two tax rates can achieve it.

A lower tax rate and a higher tax rate, and from the standpoint of economic well-being, the lower tax rate is the most efficient because more of the economic output stays in the hands of economic actors, businesses, and individuals.
High tax rates lower tax revenue
It means that if the tax rate is below the most efficient tax rate, “t”, governments can increase their revenue by increasing the tax rate. However, as soon as the tax rate goes over “t”, any increase in taxation would result in a decreased revenue.
Why? Three effects combine to lower the tax revenue.
First, the high tax rate is a disincentive to work harder and to be entrepreneurial. Why work more if you can’t keep enough of what you produce. Leisure starts to be more valuable than income-producing activities.
Secondly, economic actors start to employ tax avoidance tactics and even tax evasion tactics. Tax avoidance is legal; individuals and businesses use loopholes to lower their tax bills. On the other hand, tax evasion is illegal; individuals and companies underreport their income. Furthermore, the economy can shift from exchanging money to barter, which is way harder to tax.
Finally, some individuals may want to emigrate to lower their tax bills, especially highly skilled workers, who usually provide a lot of tax revenue. And businesses do it also. For example, a business can do an “inversion,” it buys a foreign firm in a low tax country, and then claims that the newly merged company is overseas.
Hence, a government should never want to go over the most efficient tax rate “t”.
The Laffer curve’s issues
This very simple curve gives us a lot of insight into what governments should do! Or is it too simplistic? Sadly, there are a lot of issues with the Laffer curve.
Let’s come back to the second assumption; a tax rate of 100% produces a tax revenue of $0. It is not always true. During wars, economic activity did not stop even if the marginal tax rates were very close to 100%. So the shape is not a simple bell curve.
The shape may not be a bell curve
Another misleading aspect of the Laffer curve is that it is often drawn symmetric, with its peak at the 50% tax rate. Even Arthur Laffer draws it that way. Why? There is no justification. The Laffer curve is probably skewed.
For example, if it is skewed to the left, to collect more tax revenue, governments should lower the maximum tax rate. It is the idea behind the Reaganomics and the Bush tax cuts.

However, it is more probable that the Laffer curve is skewed to the right. Numerous economic studies argue that the maximum tax revenue is achieved by having a marginal tax rate of 70%. The basic Laffer curve does not take into account that the tax revenue generated by high tax rates may be used to produce public goods. And that those public goods may be valued by the population, hence accepting willingly those higher tax rates, like in European Nordic countries.

As I said earlier, I am not suggesting that governments should set such high tax rates, and I do not believe that the goal should be to maximize governments’ incomes. However, to have a constructive discussion on how to handle the looming debt crisis, it is essential not to be blinded by simplistic arguments like a nicely bell-curved Laffer curve.
A single tax rate
Another aspect of the Laffer curve, which is unrealistic, is that it assumes a single tax rate. The tax code is way more complicated than that.
Asymmetric responses to tax changes
Moreover, it assumes that the economic actors act symmetrically to tax increase and decrease, which may prove to be false. For example, if taxes go up 10%, businesses will adjust, maybe by laying off employees and being more efficient. If then taxes go down to the previous level, companies will probably not come back to their former practices.
A pedagogical tool
In the end, I would say that the Laffer curve provides a simple explanation of the tax income relative to the tax rates. Used as a pedagogical tool, it is useful, but basing economic policies on it is foolish. The Laffer curve fails to capture the complexity of both our tax system and how the economic actors respond to its changes.
Share your thoughts, and thank you!
Don’t forget to share this post. You can also subscribe to my YouTube’s channel! Thank you so much for your support!
Question of the day:
How do you think governments will handle the looming debt crisis?
Recent Comments